Titanic Survival Case Study
An interactive data story about the Titanic.
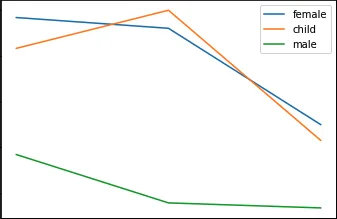
Starting from the historical claim “women and children first,” this project cleans the Titanic passenger manifest, computes survival rates by sex, class, and age group, and runs chi-square tests against a null model to determine whether the observed outcomes deviate from chance — or whether the cultural narrative holds up statistically.
The most deliberate design decision was making the analysis interactive: adjusting the child-age threshold (is an 18-year-old a child?) or filtering by passenger class immediately reruns the survival rates, group composition, expected death counts, and p-values in the browser. All of that — CSV parsing, row normalization, chi-square computation, and chart rendering — runs client-side with no server dependency. Porting the chi-square test out of a notebook and into vanilla JavaScript meant reimplementing the expected-frequency and test-statistic math by hand rather than calling into a stats library, which forced a clearer understanding of what the test actually computes.
The point of the adjustable controls is to make the conclusion’s fragility visible. The headline pattern is stark — women in first class survived at several times the rate of men in third — but exactly how significant it looks shifts as you move the child-age cutoff or restrict the sample to one class. A finding that holds at one definition can soften at another, and putting those knobs in the reader’s hands makes that dependency something they discover rather than something they have to take on faith.